TrainerDay gives you two ways to measure your fitness level: FitScore and Classic. You can switch between them anytime. Both use your training data to answer the same question—how fit are you right now?—but they measure fitness differently.
Two Models, One Goal
FitScore
DefaultHealth-first approach to training. Ideal for fitness athletes.
- Rewards aerobic volume with realistic caps
- Values strength training (30% of score)
- Bonuses for consistency and sport variety
- Multi-sport friendly
Classic
Intensity-based training load model. Familiar to power-meter cyclists.
- Based on daily training stress accumulation
- Heavily rewards intensity and volume
- Best for single-sport endurance athletes
- Includes fatigue and freshness tracking
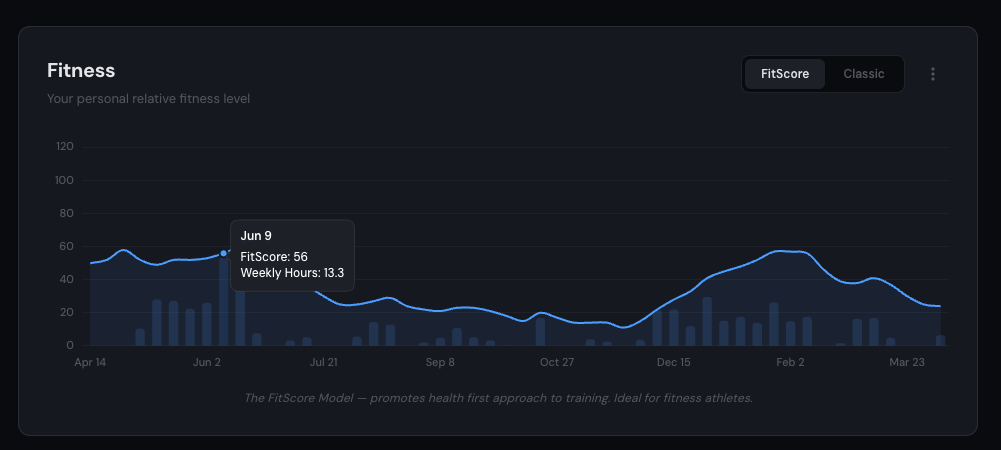
FitScore
A well-rounded fitness metric that rewards what actually matters: aerobic volume, strength training, consistency, and movement variety. It promotes a health-first approach to training rather than rewarding intensity above all else.
Weekly cardio volume with diminishing returns
Days per week with strength activity
Rewards showing up regularly (up to 5+ days/week)
Rewards doing different sports (up to 4+)
Classic
The classic intensity and volume model used by TrainingPeaks, Intervals.icu, and Strava. It tracks fitness through accumulated training stress. It works well for single-sport endurance athletes, but it puts a heavy reward on intensity, which isn't always the best approach for everyone.
Training Load (Fitness)
Think of training load as your fitness level. It's a rolling average of your daily stress over the last 42 days, weighted so recent training matters more than older training.
Training load rises when you train consistently and drops when you take time off. It moves slowly—you can't build fitness in a week, and you won't lose it in a week either. A typical recreational athlete might have a training load of 20-40. A competitive cyclist might be at 80-120.
Fatigue
Fatigue is your recent load. It's the same concept as training load but over 7 days instead of 42. It responds quickly to what you've been doing lately.
After a big training week, fatigue spikes. After a rest week, it drops fast. Fatigue tells you how much load your body is currently carrying, not how fit you are.
Stress Balance (Freshness)
Stress balance is simply training load minus fatigue—your fitness minus your recent load. It tells you how fresh you are right now.
You're fresh. Fitness exceeds fatigue. Good time to race or test.
Balanced. You're training at a sustainable rate. Most of the time you should be here.
You're fatigued. Training load exceeds fitness. Normal during heavy training blocks, but watch for overtraining.
Starting training load: When you first connect your training data, we analyze your first few months of training history to estimate a realistic starting training load. This way your chart doesn't start at zero if you've been training for years.
Training Stress (Stress)
Stress measures how much load a single workout puts on your body. A casual 1-hour ride might be 40-60 stress. A hard interval session could be 80-120. A 5-hour endurance ride might hit 250+. The number combines how long you trained with how hard you went.
How We Calculate Stress
We use the best data available for each activity, in this priority order:
Power (Best)
If your device records power data, we use Normalized Power to calculate stress. This is the gold standard—it accounts for the variable nature of real riding, weighting hard efforts more heavily than easy spinning.
Pace (Running)
For running activities with GPS data, we use Grade Adjusted Pace (GAP)—your pace corrected for hills. Running uphill at 10:00/mi is harder than running flat at 10:00/mi, and GAP accounts for that.
Heart Rate
When there's no power or pace data, heart rate tells us how hard your body was working. We compare your HR against your lactate threshold heart rate (LTHR) to estimate effort. Works for any activity with a heart rate monitor.
Duration Estimate
When none of the above are available, we estimate stress from duration and sport type. An hour of running gets a higher estimate than an hour of yoga, because it's typically more stressful. This is the least accurate method but ensures every activity counts.
Why does it matter? The more data your device records, the more accurate your stress. A power meter gives the best results. A heart rate monitor is the next best thing. If you just record duration, we'll still make a reasonable estimate—it's better than ignoring the workout.
Your Thresholds
All of these metrics depend on knowing your personal thresholds—the effort levels that are specific to you. We auto-detect these from your training data so you don't have to set them manually (though you can override them).
Lactate Threshold Heart Rate (LTHR)
The heart rate you can sustain for about an hour at maximum effort. This is the reference point for all heart rate-based stress calculations.
If you have cycling activities with both power and heart rate data, we use the relationship between the two to derive a highly accurate LTHR. Otherwise, we estimate it from your maximum heart rate. The more data you record, the more accurate this gets.
Maximum Heart Rate
Your highest recorded heart rate. We detect this automatically from your activity data—it's usually more accurate than age-based formulas or what you entered in your profile.
We filter out sensor spikes (momentary readings that are clearly errors) to make sure this value is real.
Functional Threshold Power (FTP)
The power you can sustain for about an hour. This is the reference point for all power-based metrics. We keep separate values for cycling and running since running power and cycling power are very different.
Cycling FTP currently comes from your profile setting. Running FTP is auto-detected from your best 20-minute running power efforts.
Threshold Pace (Running)
Your sustainable running pace for about an hour, adjusted for terrain using Grade Adjusted Pace. This is used for pace-based running stress when power data isn't available.
When thresholds change: If you update your FTP or we detect a new threshold from your data, all affected activities are automatically recalculated from that date forward. Your entire history stays accurate as you get fitter.
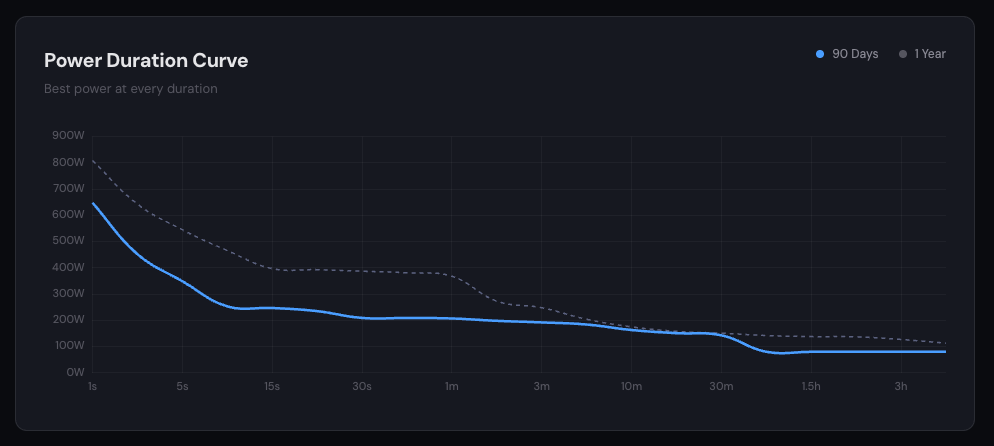
Power Duration Curve
Your best power output at every duration—from a 1-second sprint to a 3-hour endurance effort. Compare your last 90 days against your full year to see where you're improving and where you've lost ground. The curve reveals your strengths (sprinter, time trialist, climber) at a glance.