

How do I read the lines and colors on the workout graph?
On the workout screen in the TrainerDay mobile or desktop app, the bars show your targets in power-zone colors, the white line is your actual power, the red line is your heart rate, and the brighter line across the middle is your FTP.
- In the mobile or desktop app, start a workout and look at the workout graph. The bars are the workout's targets, colored by power zone: Z1 grey, Z2 blue, Z3 green, Z4 yellow, Z5 orange, Z6 red. In HR+ mode the bars are grey.
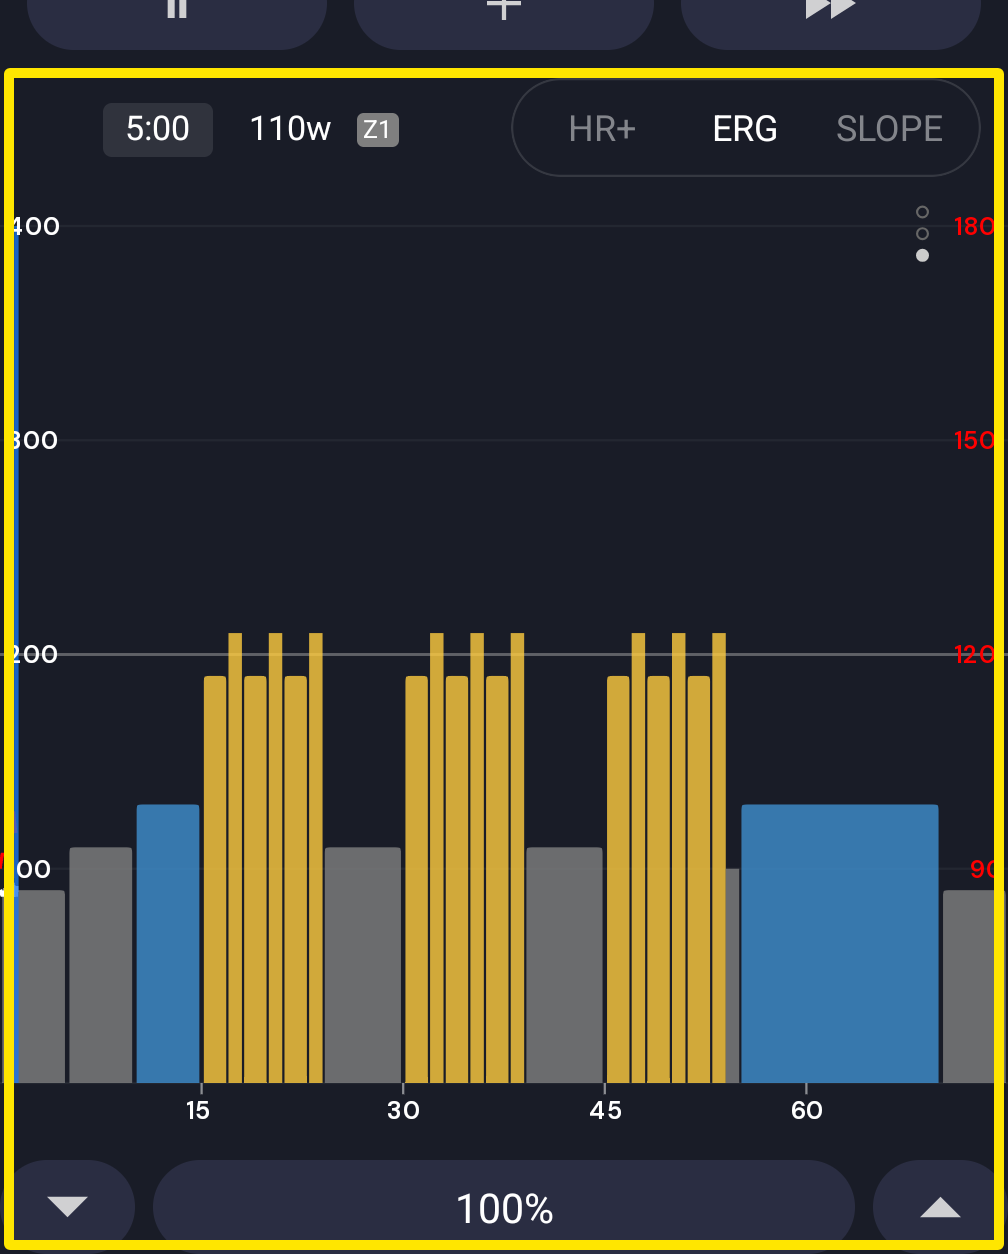 Where: Mobile app · the workout screen during a ride
- The white line is your actual power. The red line is your heart rate.
- The brighter line across the middle of the graph is your FTP (desktop: a dashed line).
- Power numbers in watts are on the left. Heart rate numbers in BPM, in red, are on the right.
- (Mobile) To see all bars in one blue, turn on Settings → Classic blue charts.
Good to know: The heart rate scale is always in BPM and is based on your threshold heart rate (the top is about 1.2 × threshold HR).
Works on: Mobile and desktop apps show the same colors and lines; the website's workout charts show the target bars only.