

How do I track my power at a set heart rate over time?
TrainerDay has no chart of your power at a set heart rate over time; the closest is comparing parts of one ride on the website, where Compare shows each part's EF (average power ÷ average heart rate).
- On the website, click My Activities in the left sidebar (app.trainerday.com/activities) and click the ride's name.
- Under the chart, click the Compare (scales) icon on two or more rows of the Blocks or Ranges table, then click Compare.
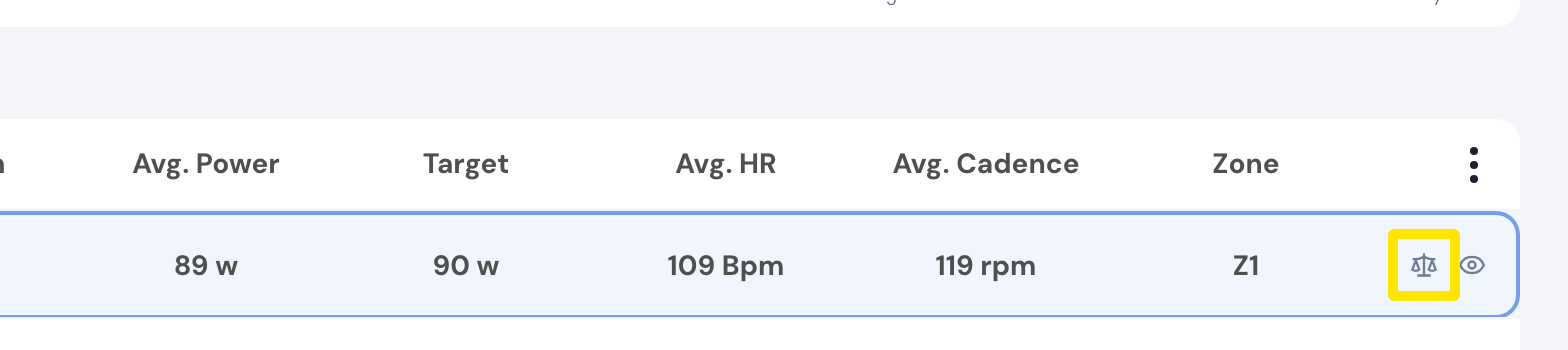 Where: Website · My Activities → click the activity's name · open it
- Read the EF row of each part. With three or more parts, EF drift under the columns shows how it changed through the set. About these numbers explains them.
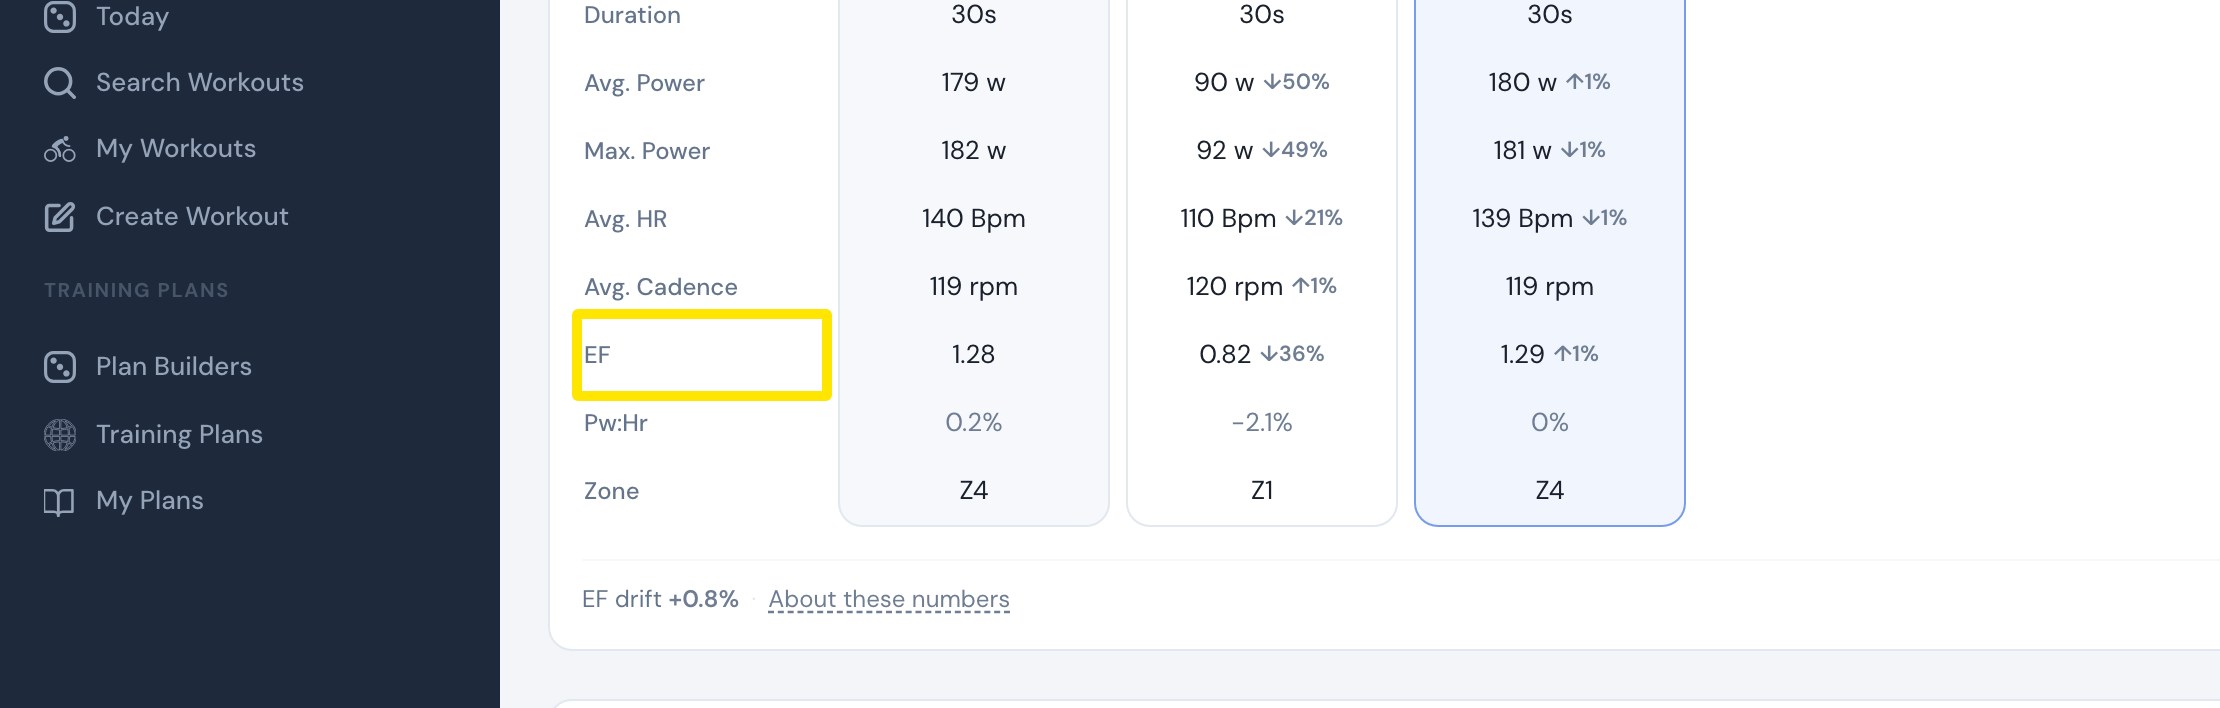 Where: Website · My Activities → click the activity's name · open it
Good to know: No app trends EF across rides. It works only within one ride.
Works on: Website and mobile app (compare a ride's blocks); not the desktop app.